
14.1. Silicon#
At a glance
- Goal:
Calculate phonon dispersion, phonon DOS, and lattice thermal conductivity of bulk Si from DFT forces.
- You will learn:
how to generate displacement patterns with alm and collect forces with
displace.pyandextract.pyhow to fit harmonic and cubic IFCs by least squares
how to calculate phonon dispersion, DOS, and thermal conductivity with anphon
how to analyze phonon lifetimes, cumulative and spectral thermal conductivity
- Prerequisites:
ALAMODE (alm and anphon) and a DFT code (QE, VASP, xTAPP, or OpenMX). The reference DFSET files let you skip the DFT calculations.
- Example files:
example/Si
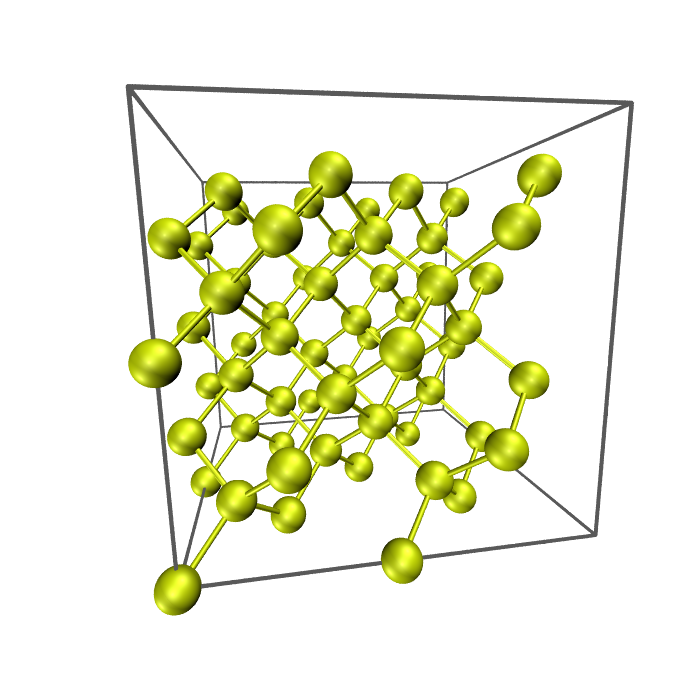
Silicon. 2x2x2 conventional supercell#
In the following, (anharmonic) phonon properties of bulk silicon (Si) are calculated by a 2x2x2 conventional cell containing 64 atoms.
1. Get displacement patterns by alm#
Copy example/Si/reference/si_alm1.in to si_alm.in in a new working directory, and open it. (The si_alm.in shipped in example/Si is the finished input of step 3, which you can use for comparison.) This file is an input for the code alm, which estimates interatomic force constants (IFC) by least-squares fitting. In the file, the crystal structure of a 2x2x2 conventional supercell of Si is specified in the &cell and the &position fields as the following:
&general
  PREFIX = si222
  MODE = suggest
  KD = Si
  PRIMCELL = A  # store the primitive cell in si222.h5 for anphon
/

&interaction
  NORDER = 1  # 1: harmonic, 2: cubic, ..
/

&cell
  20.406 # factor in Bohr unit
  1.0 0.0 0.0 # a1
  0.0 1.0 0.0 # a2
  0.0 0.0 1.0 # a3
/

&cutoff
  Si-Si None
/

&position
  1 0.0000000000000000 0.0000000000000000 0.0000000000000000
  1 0.0000000000000000 0.0000000000000000 0.5000000000000000
  1 0.0000000000000000 0.2500000000000000 0.2500000000000000
  1 0.0000000000000000 0.2500000000000000 0.7500000000000000
  1 0.0000000000000000 0.5000000000000000 0.0000000000000000
  1 0.0000000000000000 0.5000000000000000 0.5000000000000000
  1 0.0000000000000000 0.7500000000000000 0.2500000000000000
Replace the lattice constant of the supercell (20.406 Bohr) by your own value.
Then, execute alm
$ alm si_alm.in > si_alm.log1
which creates a file si222.pattern_HARMONIC in the working directory. In the pattern file, suggested displacement patterns are defined in Cartesian coordinates. As you can see in the file, there is only one displacement pattern for harmonic IFCs of bulk Si.
2. Calculate atomic forces for the displaced configurations#
Next, calculate atomic forces for all the displaced configurations defined in si222.pattern_HARMONIC. To do so, you first need to decide the magnitude of displacements \(\Delta u\), which should be small so that anharmonic contributions are negligible. In most cases, \(\Delta u \sim 0.01\) Å is a reasonable choice.
Then, prepare input files necessary to run an external DFT code for each configuration. Since this procedure is a little tiresome, we provide a subsidiary Python script for VASP, Quantum-ESPRESSO (QE), xTAPP, OpenMX, and LAMMPS. Using the script displace.py in the tools/ directory, you can generate the necessary input files as follows:
$ python displace.py --QE=si222.pw.in --mag=0.01 -pf si222.pattern_HARMONIC
$ python displace.py --VASP=POSCAR.orig --mag=0.01 -pf si222.pattern_HARMONIC
$ python displace.py --xTAPP=si222.cg --mag=0.01 -pf si222.pattern_HARMONIC
$ python displace.py --OpenMX=si222.dat --mag=0.01 -pf si222.pattern_HARMONIC
The --mag option specifies the displacement length in units of Angstrom.
You need to specify an input file with equilibrium atomic positions either by the --QE, --VASP, --xTAPP, --OpenMX or --LAMMPS.
Then, calculate atomic forces for all the configurations. This can be done with a simple shell script as follows:
#!/bin/bash

# Assume we have 20 displaced configurations for QE [disp01.pw.in,..., disp20.pw.in].

for ((i=1;i<=20;i++))
do
    num=`echo $i | awk '{printf("%02d",$1)}'`
    mkdir ${num}
    cd ${num}
    cp ../disp${num}.pw.in .
    pw.x < disp${num}.pw.in > disp${num}.pw.out
    cd ../
done
Important
In QE, you need to set tprnfor=.true. to print out atomic forces.
The next step is to collect the displacement data and force data by the Python script extract.py (also in the tools/ directory). This script can extract atomic displacements, atomic forces, and total energies from multiple output files as follows:
$ python extract.py --QE=si222.pw.in *.pw.out > DFSET_harmonic
$ python extract.py --VASP=POSCAR.orig vasprun*.xml > DFSET_harmonic
$ python extract.py --xTAPP=si222.cg *.str > DFSET_harmonic
$ python extract.py --OpenMX=si222.dat *.out > DFSET_harmonic
In the above examples, atomic displacements and corresponding atomic forces of all the configurations are merged as DFSET_harmonic.
These files will be used in the following fitting procedure as DFSET (See Format of DFSET).
Note
For your convenience, we provide the DFSET_harmonic file in the reference/ subdirectory. This file is generated by the Quantum-ESPRESSO package with --mag=0.01. You can proceed to the next step by copying this file to the working directory.
3. Estimate force constants by fitting#
Edit the file si_alm.in to perform least-squares fitting.
Change the MODE = suggest to MODE = optimize as follows:
&general
  PREFIX = si222
  MODE = optimize   # <-- here
  KD = Si
  PRIMCELL = A
/
Also, add the &optimize field as:
&optimize
  DFSET = DFSET_harmonic
/
Then, execute alm again
$ alm si_alm.in > si_alm.log2
This time alm extracts harmonic IFCs from the given displacement-force data set (DFSET_harmonic).
You can find the file si222.h5 in the working directory, which contains crystal structure, symmetry, IFCs,
and all other information necessary for subsequent phonon calculations.
If you also want to inspect the IFCs, add FCS_ALAMODE = 1 to the &general field: alm then writes the
human-readable listing si222.fcs (and the legacy si222.xml) as well.
The file si222.fcs contains all IFCs in Rydberg atomic units, and
you can find symmetrically irreducible sets of IFCs in the first part as:
si222.fcs (first 40 lines)
 *********************** Force Constants (FCs) ***********************
 *        Force constants are printed in Rydberg atomic units.       *
 *        FC2: Ry/a0^2     FC3: Ry/a0^3     FC4: Ry/a0^4   etc.      *
 *        FC?: Ry/a0^?     a0 = Bohr radius                          *
 *                                                                   *
 *        The value shown in the last column is the distance         *
 *        between the most distant atomic pairs.                     *
 *********************************************************************

 ----------------------------------------------------------------------
      Index              FCs         P        Pairs     Distance [Bohr]
 (Global, Local)              (Multiplicity)
 ----------------------------------------------------------------------

  *FC2
       1       1     2.7613553e-01   1     1x     1x       0.000
       2       2    -9.5252308e-04   2     1x     2x      10.203
       3       3    -3.7574247e-04   2     1z     2z      10.203
       4       4     8.8561868e-03   1     1x     3x       7.215
       5       5     1.9633030e-03   1     1x     3y       7.215
       6       6    -3.9798276e-03   1     1y     3y       7.215
       7       7    -3.9080855e-03   1     1y     3z       7.215
       8       8     8.2188178e-03   4     1x     6x      14.429
       9       9     4.3878651e-05   4     1y     6y      14.429
      10      10    -6.7358757e-02   1     1x     9x       4.418
      11      11    -4.7360832e-02   1     1x     9y       4.418
      12      12     1.0670028e-03   1     1x    10x       8.460
      13      13    -8.2098635e-04   1     1x    10y       8.460
      14      14    -6.9742830e-04   1     1x    10z       8.460
      15      15     2.1135669e-04   1     1z    10z       8.460
      16      16    -4.3031422e-03   1     1x    11x      11.118
      17      17     5.0759340e-04   1     1x    11y      11.118
      18      18    -4.7178438e-04   1     1y    11y      11.118
      19      19    -4.7518256e-04   1     1y    11z      11.118
      20      20    -7.4138963e-04   2     1x    20x      12.496
      21      21     1.2900836e-03   2     1x    20y      12.496
      22      22    -1.7263732e-04   2     1x    20z      12.496
      23      23     6.4515756e-05   2     1z    20z      12.496
      24      24     3.5369980e-04   1     1x    28x      13.254
      25      25    -5.1486930e-04   1     1x    28y      13.254
Harmonic IFCs \(\Phi_{\mu\nu}(i,j)\) in the supercell are given in the third column and the multiplicity \(P\) is the number of times each interaction \((i, j)\) occurs within the given cutoff radius. For example, \(P = 2\) for the pair \((1x, 2x)\) because the distance \(r_{1,2}\) is exactly the same as the distance \(r_{1,2'}\) where the atom 2’ is a neighboring image of atom 2 under the periodic boundary condition. If you compare the magnitude of IFCs, the values in the third column should be divided by \(P\).
In the log file si_alm.log2, the fitting error is printed. Try
$ grep "Fitting error" si_alm.log2
Fitting error (%) : 0.567
The file si222.h5 is the one that anphon reads in the following steps. To check its content without writing the text files, use the Python script fcsinfo.py in the tools/ directory (h5py is required.):
$ python fcsinfo.py si222.h5
It prints the input variables of the alm run, the primitive cell and the supercell, and, for each order, the number of IFCs, the largest value, the longest interaction distance, and, for harmonic IFCs, the residual of the acoustic sum rule:
[PrimitiveCell]  2 atoms, volume 265.536159 bohr^3
  a1 =     0.00000000     5.10150000     5.10150000  (bohr)
  a2 =     5.10150000     0.00000000     5.10150000  (bohr)
  a3 =     5.10150000     5.10150000     0.00000000  (bohr)
  composition: Si2
  ...
[ForceConstants]
  Order2: 1386 entries [Ry/bohr^2], max|Phi| 2.761355e-01, max distance 17.672114 bohr
    ASR residual max|sum_j Phi(i,j)| = 2.932e-16
--order 2 also lists the individual entries, and --verbose prints everything.
4. Calculate phonon dispersion and phonon DOS#
Open the file si_phband.in and edit it for your system.
&general
  PREFIX = si222
  MODE   = phonons
  FCSFILE = si222.h5
/

&kpoint
  1  # KPMODE = 1: line mode
  G 0.0 0.0 0.0 X 0.5 0.5 0.0 51
  X 0.5 0.5 1.0 G 0.0 0.0 0.0 51
  G 0.0 0.0 0.0 L 0.5 0.5 0.5 51
/
Please specify the force-constant file you obtained in step 3 with the FCSFILE-tag as above.
No &cell-field is needed: because of PRIMCELL = A in the alm input, si222.h5 stores the primitive cell,
and anphon works in that cell.
Without PRIMCELL, the file stores the 64-atom supercell, and the lattice vectors of the primitive cell must then be given
in the &cell-field (see &cell-field).
The element names are also read from the force-constant file, and the atomic masses are taken from the standard atomic weights unless MASS is given.
In phonon dispersion calculations, the first entry in the &kpoint-field should be 1 (KPMODE = 1).
Then, execute anphon
$ anphon si_phband.in > si_phband.log
which creates a file si222.bands in the working directory. In this file, phonon frequencies along the given reciprocal path are printed in units of cm-1 as:
#  G X G L
# 0.000000 0.615817 1.486715 2.020028
# k-axis, Eigenvalues [cm^-1]
0.000000   1.097373e-10   1.097373e-10   1.097373e-10   5.129224e+02   5.129224e+02   5.129224e+02
0.012316   6.009520e+00   6.009520e+00   1.022526e+01   5.128286e+02   5.128286e+02   5.128923e+02
0.024633   1.200989e+01   1.200989e+01   2.044420e+01   5.125479e+02   5.125479e+02   5.128019e+02
0.036949   1.799191e+01   1.799191e+01   3.065053e+01   5.120824e+02   5.120824e+02   5.126510e+02
0.049265   2.394626e+01   2.394626e+01   4.083799e+01   5.114353e+02   5.114353e+02   5.124391e+02
0.061582   2.986346e+01   2.986346e+01   5.100034e+01   5.106114e+02   5.106114e+02   5.121656e+02
0.073898   3.573381e+01   3.573381e+01   6.113142e+01   5.096167e+02   5.096167e+02   5.118299e+02
You can plot the phonon dispersion relation with gnuplot or any other plot software.
For visualizing phonon dispersion relations, we provide a Python script plotband.py in the tools/ directory (Matplotlib is required.). Try
$ python plotband.py si222.bands
Then, the phonon dispersion is displayed as follows:
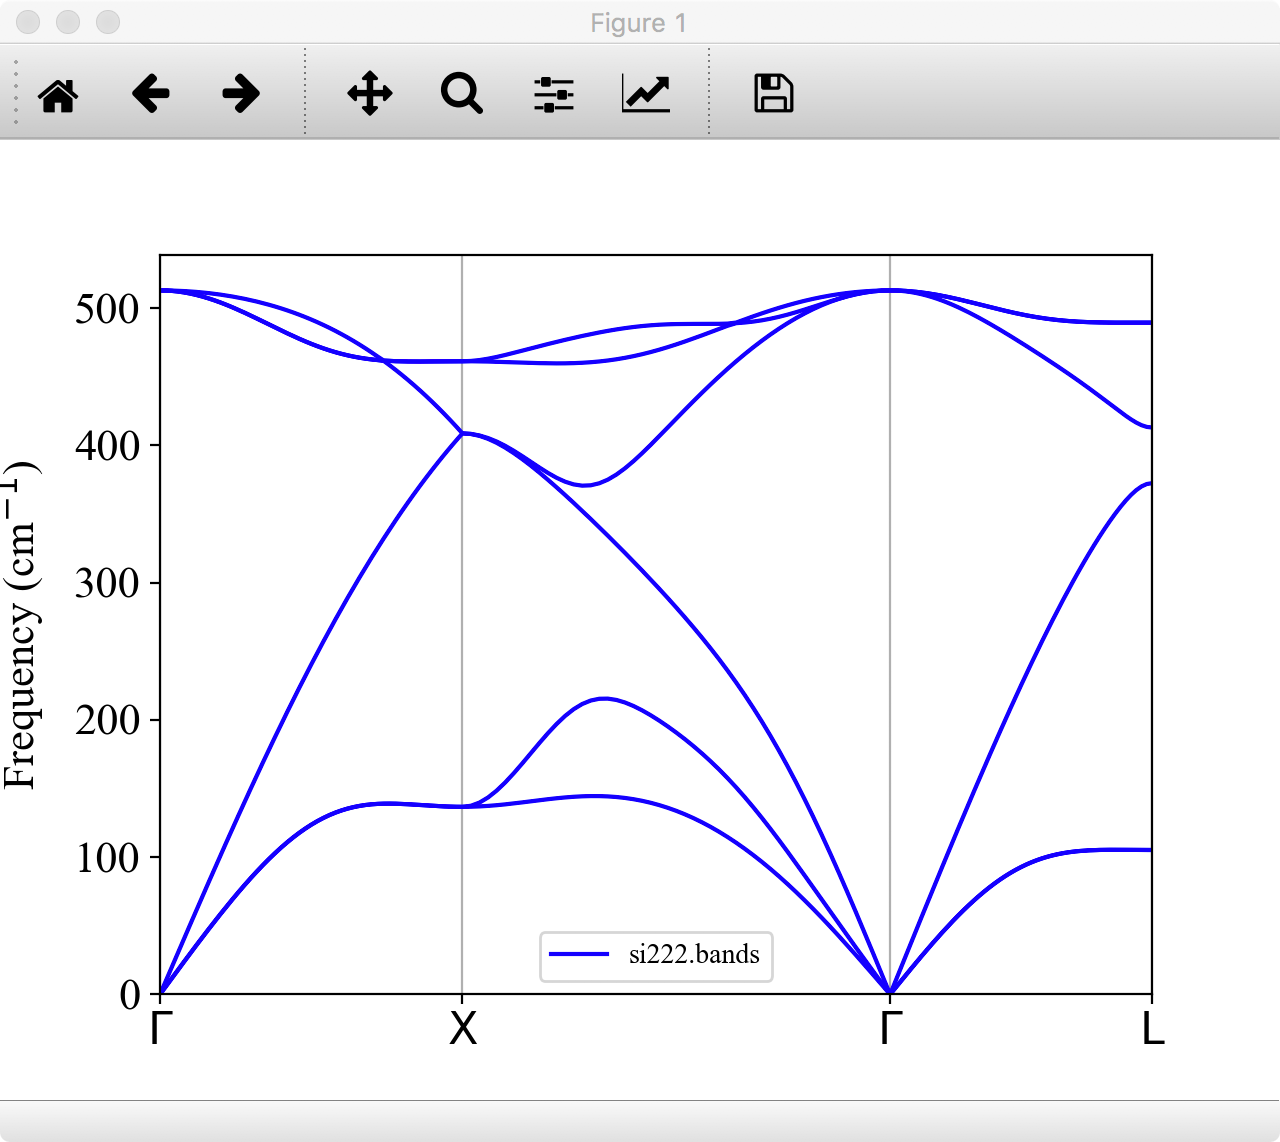
You can save the figure as png, eps, or other formats from this window.
You can also change the energy unit of phonon frequency from cm-1 to THz or meV by the --unit option.
For more detail of the usage of plotband.py, type
$ python plotband.py -h
Next, let us calculate the phonon DOS. Copy si_phband.in to si_phdos.in and edit the &kpoint field as follows:
&kpoint
  2  # KPMODE = 2: uniform mesh mode
  20 20 20
/
Then, execute anphon
$ anphon si_phdos.in > si_phdos.log
This time, anphon creates files si222.dos and si222.thermo in the working directory, which contain phonon DOS and thermodynamic functions, respectively. For visualizing phonon DOS and projected DOSs, we provide a Python script plotdos.py in the tools/ directory (Matplotlib is required.). The command
$ python plotdos.py --emax 550 --nokey si222.dos
will show the phonon DOS of Si by a pop-up window:

The interactive figure above shows the DOS next to the phonon dispersion;
plotdos.py plots the DOS alone, with the frequency on the horizontal axis.
To improve the resolution of DOS, try again with a denser \(k\) grid and a smaller DELTA_E value.
5. Estimate cubic IFCs for thermal conductivity#
Note
Note that there are more efficient ways to calculate anharmonic IFCs, especially when you calculate the quartic or higher-order terms. Please see BaTiO3 : Anharmonic interatomic force constants (IFCs) and Si : Anharmonic interatomic force constants (IFCs) for details.
Copy file si_alm.in to si_alm2.in. Edit the &general, &interaction, and &cutoff fields of si_alm2.in as the following:
&general
  PREFIX = si222_cubic
  MODE = suggest
  KD = Si
  PRIMCELL = A
/
Change the PREFIX from si222 to si222_cubic and set MODE to suggest.
&interaction
  NORDER = 2
/
Change the NORDER tag from NORDER = 1 to NORDER = 2 to include cubic IFCs.
Here, we consider cubic interaction pairs up to second nearest neighbors by specifying the cutoff radii as:
&cutoff
  Si-Si None 7.3
/
7.3 Bohr is slightly larger than the distance of second nearest neighbors (7.21461 Bohr). Change the cutoff value appropriately for your own case. (Atomic distances can be found in the file si_alm.log1.)
Then, execute alm
$ alm si_alm2.in > si_alm2.log
which creates files si222_cubic.pattern_HARMONIC and si222_cubic.pattern_ANHARM3.
Then, calculate atomic forces of displaced configurations given in the file si222_cubic.pattern_ANHARM3, and collect the displacement and force datasets to a file DFSET_cubic as you did for harmonic IFCs in Step 2.
Note
Since making DFSET_cubic requires moderate computational resources, you can skip this procedure by copying file reference/DFSET_cubic to the working directory. The file we provide is generated by the Quantum-ESPRESSO package with --mag=0.04.
In si_alm2.in, change MODE = suggest to MODE = optimize and add the following:
&optimize
  DFSET = DFSET_cubic
  FC2FIX = si222.h5 # Fix harmonic IFCs
/
By the FC2FIX tag, harmonic IFCs are fixed to the values in si222.h5.
Then, execute alm again
$ alm si_alm2.in > si_alm2.log2
which creates the file si222_cubic.h5. This time cubic IFCs are also included in the file.
Note
In the above example, we obtained cubic IFCs by least-squares fitting with harmonic IFCs being fixed to the value of the previous harmonic calculation. You can also estimate both harmonic and cubic IFCs simultaneously instead. To do this, merge DFSET_harmonic and DFSET_cubic as
$ cat DFSET_harmonic DFSET_cubic > DFSET_merged
and change the &optimize field as the following:
&optimize
  DFSET = DFSET_merged
/
The Python script calcpes.py in the tools/ directory (ASE is required.) evaluates the Taylor-expansion potential defined by the IFCs, which is a quick way to see what the cubic terms do. For example, move atom 1 along [111], toward one of its nearest neighbors, from \(-0.3\) to \(0.3\) Bohr. The displacement file lists the displacements (in Bohr) of all 64 atoms for each structure, one atom per line:
$ python -c "
import numpy as np, sys
for u in np.linspace(-0.3, 0.3, 7):
    d = np.zeros((64, 3)); d[0] = u / np.sqrt(3)
    np.savetxt(sys.stdout, d)" > disp111.dat
$ python calcpes.py --fcs si222_cubic.h5 --disp disp111.dat --unit eV
# potential energies (eV)
#           total              fc2              fc3
   1.42949818e-01   1.68940899e-01  -2.59910812e-02
   6.73837830e-02   7.50848441e-02  -7.70106110e-03
   1.78085784e-02   1.87712110e-02  -9.62632637e-04
   0.00000000e+00   0.00000000e+00   0.00000000e+00
   1.97338437e-02   1.87712110e-02   9.62632637e-04
   8.27859052e-02   7.50848441e-02   7.70106110e-03
   1.94931980e-01   1.68940899e-01   2.59910812e-02
The harmonic energy (fc2) is symmetric in \(u\), while the cubic term (fc3) changes sign,
so pushing the atom into the bond (\(u > 0\)) costs more energy than pulling it away.
(With --print-forces, the script prints the atomic forces instead.)
The same script checks how well the IFCs reproduce the DFT data.
With --dfset, it reads the displacements and the DFT forces from a DFSET file
(in Bohr and Ry/Bohr) and compares them with the forces of the Taylor expansion;
--plot saves a parity plot:
$ python calcpes.py --fcs si222_cubic.h5 --dfset DFSET_cubic --plot parity.png
# DFSET_cubic: 20 snapshots of 64 atoms
# force error |F_model - F_DFT| / |F_DFT| = 0.1206 %, RMS 3.1199e-06 Ry/Bohr
#  snapshot  force error (%)
          1           0.0527
          2           0.3099
...
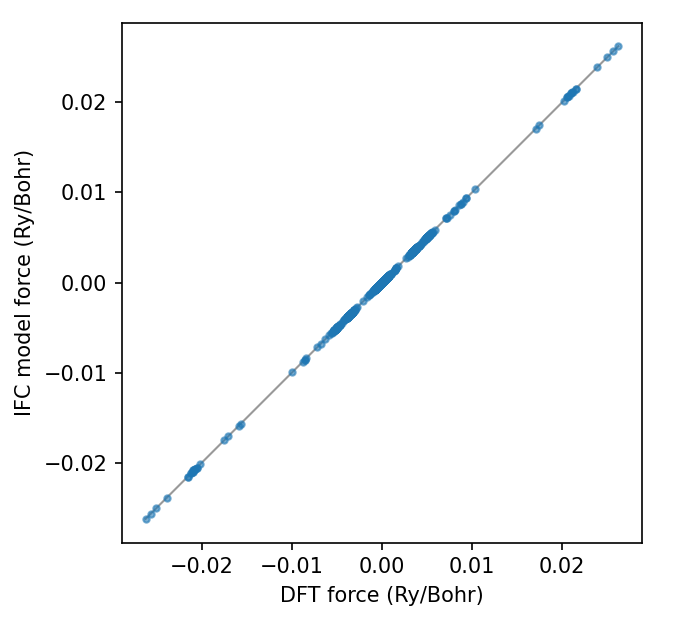
Forces of the harmonic + cubic IFC model against the DFT forces of DFSET_cubic#
The relative force error is the fitting error printed in si_alm2.log2.
With --maxorder 2 only the harmonic IFCs are used, and the error grows to 3.25%: this is the part of the forces
that the cubic IFCs account for.
If the DFSET file has E_pot lines, as written by extract.py, the energies are compared as well.
Because the energy of the undisplaced supercell is not in the file, it is fitted, unless you give it by --e0 (in eV).
In all cases, the supercell is taken from the IFC file; give --structure to use another file readable by ASE.
6. Calculate thermal conductivity#
Copy file si_phdos.in to si_RTA.in and edit the MODE and FCSFILE tags as follows:
&general
  PREFIX = si222
  MODE = kappa
  FCSFILE = si222_cubic.h5
/
In addition, change the \(k\) grid density as:
&kpoint
  2
  10 10 10
/
Then, execute anphon as a background job
$ anphon si_RTA.in > si_RTA.log &
When the job finishes, you can find a file si222.kl in which the lattice thermal conductivity is saved. You can plot this file using gnuplot (or any other plotting software) as follows:
$ gnuplot
gnuplot> set logscale xy
gnuplot> set xlabel "Temperature (K)"
gnuplot> set ylabel "Lattice thermal conductivity (W/mK)"
gnuplot> plot "si222.kl" usi 1:2 w lp
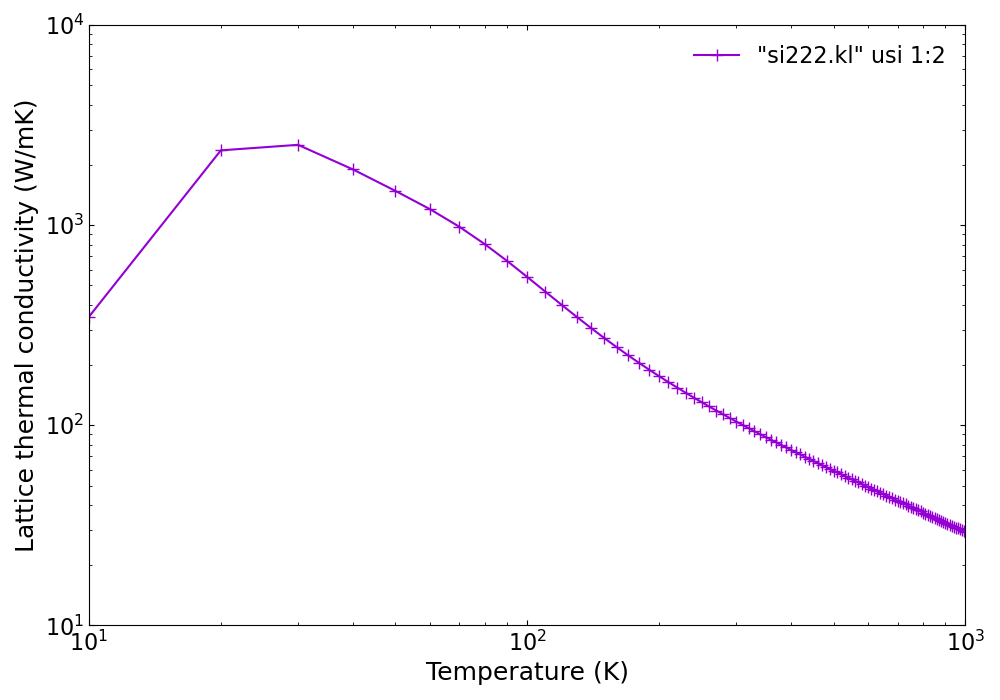
Calculated lattice thermal conductivity of Si (click to enlarge)#
As you can see, the thermal conductivity has a peak at low temperature. Below the peak, the thermal
conductivity is limited by the phonon-isotope scattering, which is included by default (ISOTOPE = 1).
The phonon-boundary scattering, which becomes dominant in the low-temperature range, is not included in the
present calculation. The effect of the boundary scattering can be included using the python script analyzer.py in the tools directory:
$ analyzer.py --calc kappa --size 1.0e+6 --h5 si222.kappa.h5 > si222_boundary_1mm.kl
(--3ph si222.result can be used instead of --h5 si222.kappa.h5 when the calculation was run with FILE_FORMAT = text.)
In this script, the phonon lifetimes are altered using the Matthiessen’s rule
Here, the first term on the right-hand side of the equation is the scattering rate due to
the phonon-phonon scattering and the second term is the scattering rate due to a grain boundary of size \(L\).
The size \(L\) must be specified using the --size option in units of nm. The boundary effect further
reduces the thermal conductivity in the low-temperature range.
Note
When a calculation is performed with a smearing method (ISMEAR=0 or 1) instead of the
tetrahedron method (ISMEAR=-1), the thermal conductivity may have a peak structure in the very low-temperature region even without the boundary effect. This peak occurs because of the finite smearing width \(\epsilon\) used in the smearing methods. As we decrease the \(\epsilon\) value, the peak value of \(\kappa\) should disappear. In addition, a very dense \(q\) grid is necessary for describing phonon excitations and thermal transport in the low-temperature region (regardless of the ISMEAR value).
7. Analyze results#
There are many ways to analyze the result for a better understanding of nanoscale thermal transport. Some selected features are introduced below:
Phonon lifetime#
The file si222.kappa.h5 contains phonon frequencies, group velocities, and linewidths at irreducible \(k\) points
(with FILE_FORMAT = text the same data are written to the text file si222.result).
You can extract phonon lifetime from this file as follows:
$ analyzer.py --calc tau --temp 300 --h5 si222.kappa.h5 > tau300K_10.dat
$ gnuplot
gnuplot> set xrange [1:]
gnuplot> set logscale y
gnuplot> set xlabel "Phonon frequency (cm^{-1})"
gnuplot> set ylabel "Phonon lifetime (ps)"
gnuplot> plot "tau300K_10.dat" using 4:6 w p
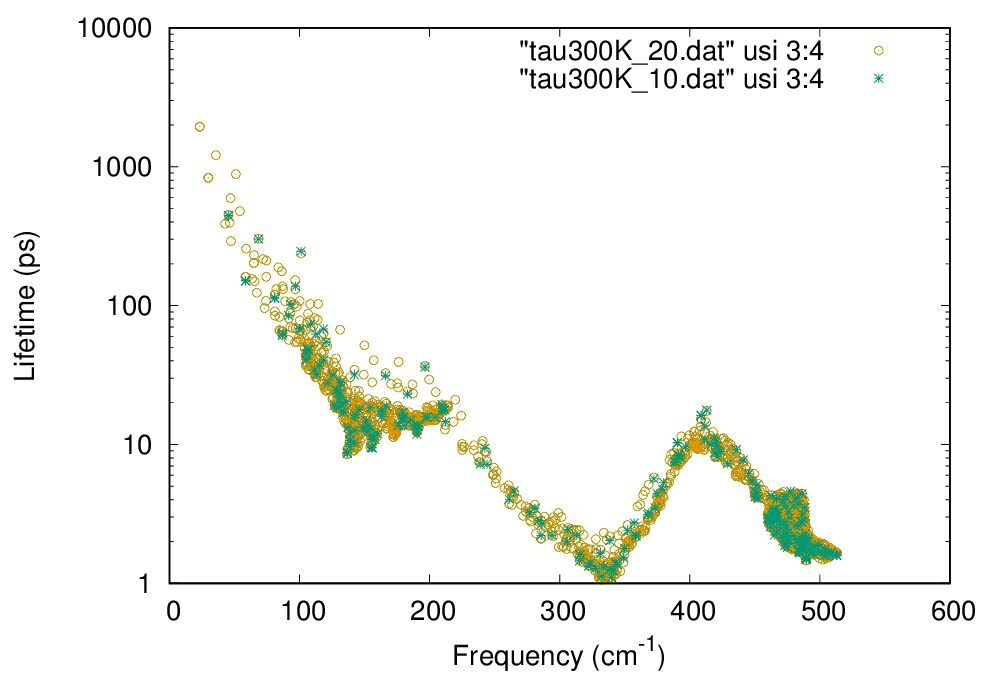
Phonon lifetime of Si at 300 K (click to enlarge)#
In the above figure, phonon lifetimes calculated with \(20\times 20\times 20\ q\) points are also shown by open circles.
Cumulative thermal conductivity#
Following the procedure below, you can obtain the cumulative thermal conductivity:
$ analyzer.py --calc cumulative --temp 300 --h5 si222.kappa.h5 > cumulative_300K_10.dat
$ gnuplot
gnuplot> set logscale x
gnuplot> set xlabel "L (nm)"
gnuplot> set ylabel "Cumulative kappa (W/mK)"
gnuplot> plot "cumulative_300K_10.dat" using 1:2 w lp
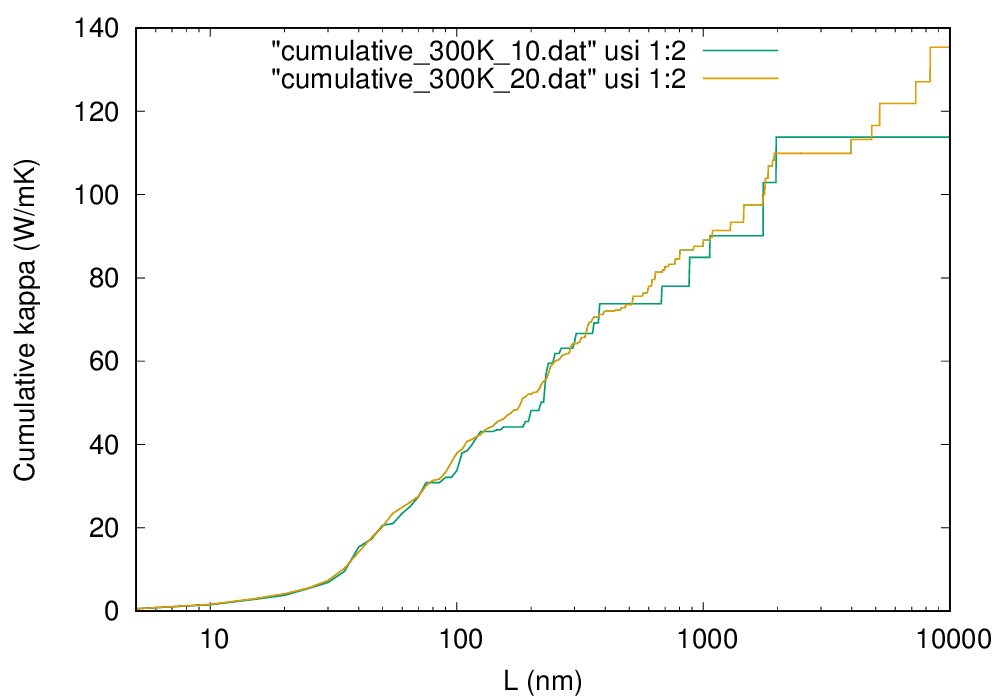
Cumulative thermal conductivity of Si at 300 K (click to enlarge)#
To draw a smooth line, you have to use a denser \(q\) grid as shown in the figure by the orange line, which are obtained with \(20\times 20\times 20\ q\) points.
Beyond the relaxation-time approximation#
The RTA neglects the in-scattering term of the collision operator and therefore underestimates \(\kappa\)
of crystals in which Normal processes are important (see this page).
To solve the linearized Boltzmann transport equation instead, add a SOLVER tag to the &kappa field of
si_RTA.in:
&kappa
 SOLVER = VBTE  # RTA (default), IBTE, VBTE, or DBTE
/
and run anphon again. The converged result is saved in si222.kl_iter with the same layout as si222.kl, so both can be plotted together:
$ gnuplot
gnuplot> set logscale xy
gnuplot> plot "si222.kl" usi 1:2 w lp title "RTA", "si222.kl_iter" usi 1:2 w lp title "VBTE"
For silicon on this \(10\times 10\times 10\) grid the correction is about 2% at room temperature (\(\kappa\) = 104.4 W/mK in the RTA and 106.9 W/mK with VBTE at 300 K; IBTE gives the same result) but exceeds 25% at 20 K and below, where Normal processes dominate. It is much larger in materials with very high thermal conductivity such as diamond or BAs.
Thermal conductivity spectrum#
To calculate the spectrum of thermal conductivity, modify the si_RTA.in as follows:
&general
  PREFIX = si222
  MODE = kappa
  FCSFILE = si222_cubic.h5

  EMIN = 0; EMAX = 550; DELTA_E = 1.0 # <-- frequency range
/

&kpoint
 2
 10 10 10
/

&kappa
 KAPPA_SPEC = 1 # compute spectrum of kappa
/
The frequency range is specified with the EMIN, EMAX, and DELTA_E tags, and KAPPA_SPEC = 1 is set in the &kappa field. Then, execute anphon again
$ anphon si_RTA.in > si_RTA2.log
After the calculation finishes, you can find the file si222.kl_spec which contains the spectra of thermal conductivity at various temperatures. You can plot the data at room temperature as follows:
$ awk '{if ($1 == 300.0) print $0}' si222.kl_spec > si222_300K_10.kl_spec
$ gnuplot
gnuplot> set xlabel "Frequency (cm^{-1})"
gnuplot> set ylabel "Spectrum of kappa (W/mK/cm^{-1})"
gnuplot> plot "si222_300K_10.kl_spec" using 2:3 w l lt 2 lw 2
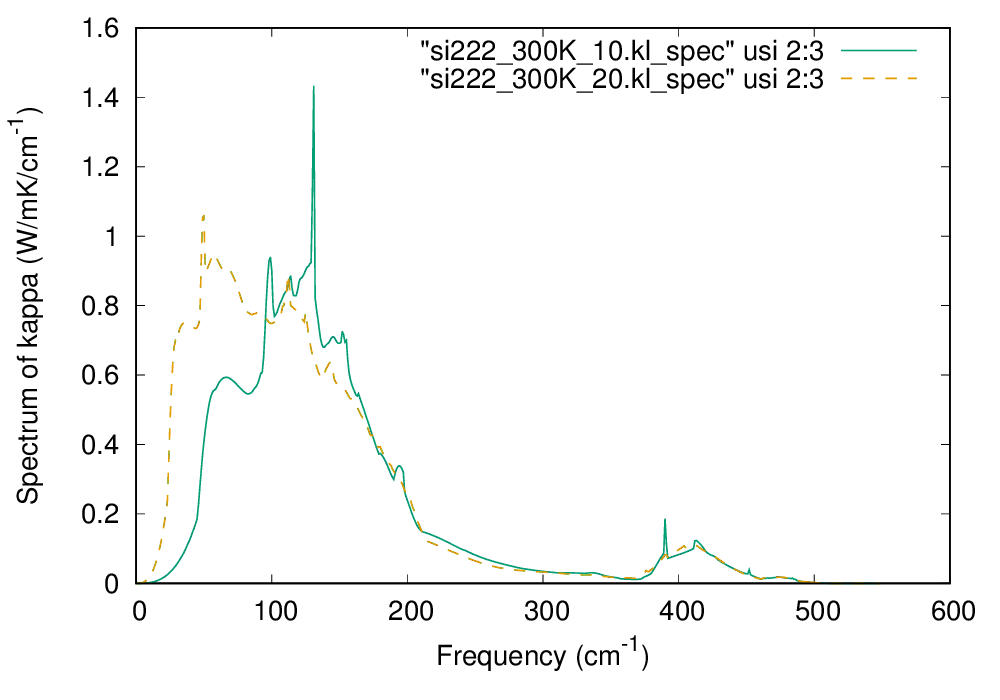
The spectrum of thermal conductivity of Si at 300 K (click to enlarge)#
In the above figure, the computational result with \(20\times 20\times 20\ q\) points is also shown by the dashed line. From the figure, we can observe that low-energy phonons below 200 cm\(^{-1}\) account for more than 80% of the total thermal conductivity at 300 K.